22 May 2011 Joplin, Missouri Tornado Event Case Study
22 May 2011 Joplin, MO; EF5 Tornado Event
Begin Jasper County 2240 UTC 22 May 2011.
End Newton County 2320 UTC 22 May 2011.
Springfield, MO radar station. Weather records are provided for: Bartlesville, OK; Joplin, MO; Bentonville, AR; Monett, MO; Clinton, MO; Springfield, MO; Branson, MO; and Ft. Leonard Wood, MO.

Fig. 6. 2131 UTC 22 May 2011, 69 minutes before the start of the Joplin event.
A cold front approaches southeastern Kansas in the hours leading up to the start of the Joplin event. Figure 6 shows activity south of Joplin and north of Springfield beginning to divide the warm air southeast of the storm cells. A small region of closure is developing in Vernon County directly north of Joplin, indicated by the dotted yellow line. At this time the pressure at the Joplin Airport is 752.9mm Hg and falling, and no evidence of closure has developed.
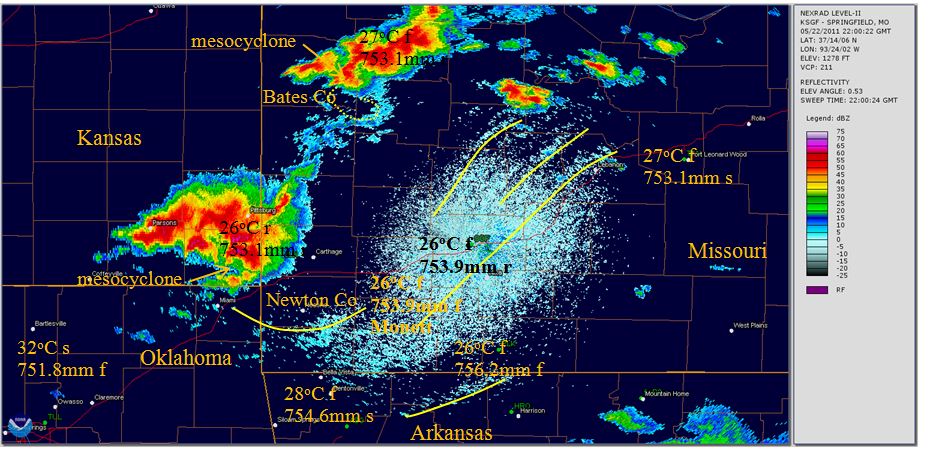
Fig. 7. 2200 UTC 22 May 2011, 40 minutes before the start of Joplin event.
Figure 7, 29 minutes later, shows that closure has been achieved in Bates County, north of Joplin, and an associated mesocyclone is developing. Over the five minutes from 2136 to 2141 UTC this formation transitions from no closure or mesocyclone, to closure with an associated “horseshoe-shaped” mesocyclone precursor, that then evolves into the mesocyclone identified in Figure 7.
Figure 7 also shows convection rolls east of the storm front through the Springfield ground clutter zone, with areas of significant concentration southeast of Joplin, just north of the Arkansas border, and northeast of Springfield. The initial mesocyclone hook echo identified in the southeast corner of Kansas ultimately evolves into the Joplin tornado. The pressure at the Joplin Airport is 753.1mm Hg and rising. Over this time period the relative humidity in Monett, southwest of Springfield, rose from 78% at 2155 UTC to 83% at 2215 UTC, where it remained steady until 2255 UTC, then rose to 89% at 2315 UTC (five minutes before the end of the event). Over that period the Monett barometric pressure vacillated between 753.6mm Hg and 753.9mm Hg (likely fluctuating around 753.75mm Hg), consistent with dynamic equilibrium within a closure region. Monett appears to have been near the front edge of the Joplin closure region over most of the event duration.
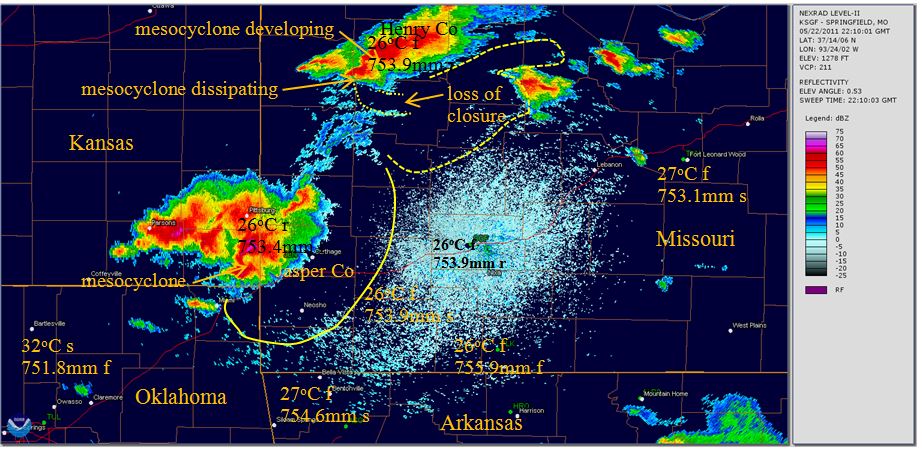
Fig. 8. 2210 UTC 22 May 2011, 30 minutes before the start of the Joplin event.
Figure 8 shows the loss of closure coinciding with the dissipation of the Bates County mesocyclone. No tornado was recorded by NCDC for Bates County through this time period. Clarification of the closure region of the mesocyclone developing in Henry County north of Springfield (dashed line) is becoming apparent. In Clinton, Missouri, near the Henry County mesocyclone, the temperature is falling and barometric pressure is rising as the cold front moves through. It is likely that the loss of closure associated with the Bates County vortex increased the pressure in the adjacent closure region, contributing to the development of the mesocyclone in Henry County. This mesocyclone appears to be relatively intense at this time, indicated by the storm cell on the east side of the closure region. It’s behavior is indicative of being within a larger overall closure region bounded to its east.
The closure region associated with the Joplin event (solid line) is also clarifying, and closure activity in northeast Oklahoma is evident. The mesocyclone in southeast Kansas is intensifying, 30 minutes prior to touchdown. Convective rolls across the Springfield ground clutter zone continue.
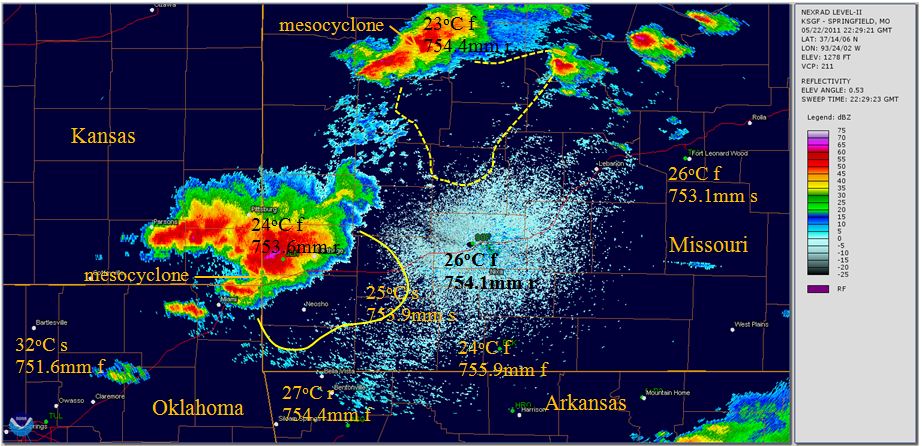
Fig. 9. 2229 UTC 22 May 2011, 11 minutes before the start of the Joplin event.
Figure 9 shows that the Henry County mesocyclone continues to develop; however, the closure region associated with it is becoming irregular. 11 minutes prior to Joplin tornado touchdown, its mesocyclone crosses from Kansas into Missouri and its associated closure region continues to shrink. The mesocyclone under positive pressure maintains relatively steady state conditions within the region of closure, consistent with steady barometric pressure in Monett.
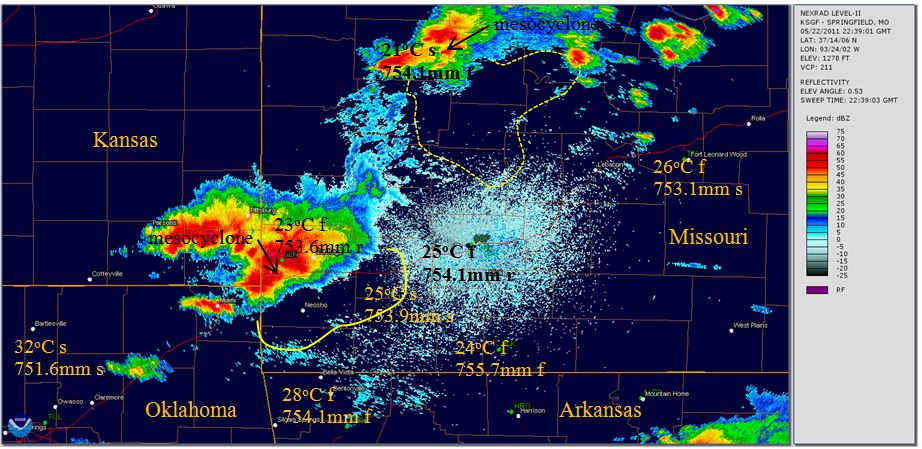
Fig. 10. 2239 UTC 22 May 2011, one minute before the start of the Joplin event.
Figure 10 shows conditions within a minute of Joplin tornado touchdown. Establishing 2239 UTC as a reference point, the identified Joplin region of closure encompasses an area of approximately 1566 km2. Conditions in Monett remain stable. The region of closure north of Springfield seems to remain intact; however, it is becoming more irregular and the associated mesocyclone in Henry County begins to lose definition and destabilize. On the back side of the cold front the temperature in Clinton has stabilized at 21oC after dropping 6oC over 68 minutes. The 23oC and falling temperature at the Joplin Airport is approaching that point, and the pressure continues to rise, adjacent to the touchdown point.
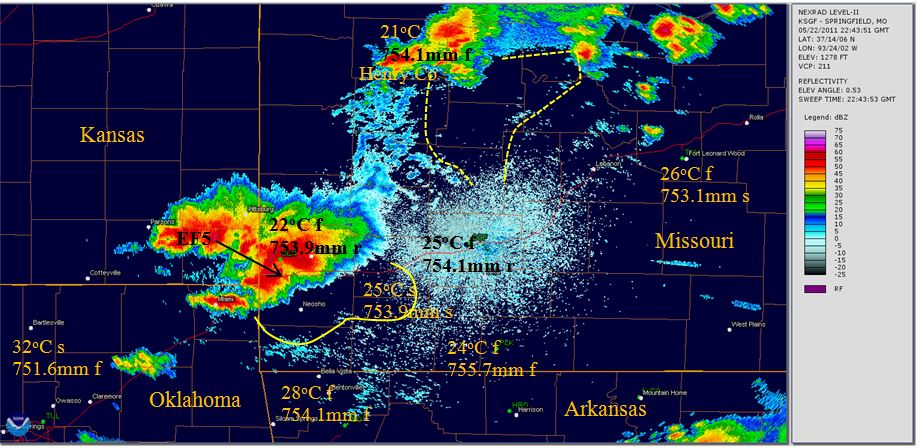
Fig. 11. 2243 UTC 22 May 2011, three minutes into the Joplin event.
Figure 11 shows the loss of closure north of Springfield and associated dissipation of the Henry County mesocyclone. The region of closure east and south of Joplin retains integrity, and the associated tornado intensifies to EF5. Monett remains steady, Joplin’s temperature falls and pressure rises.
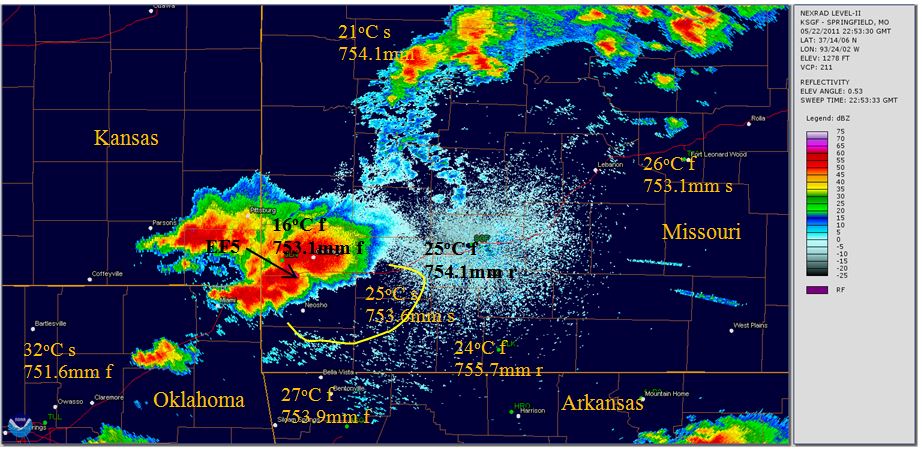
Fig. 12. 2253 UTC 22 May 2011, 13 minutes into the Joplin event.
13 minutes into the Joplin event, Figure 12 shows the tornado tracking east along the southern edge of Jasper County, continuing to intensify. The associated closure region maintains stability and continues to shrink. Except for an isolated pressure dip to 753.6mm Hg, conditions in Monett remain stable. It is clear that the region of closure north of Springfield has been lost.
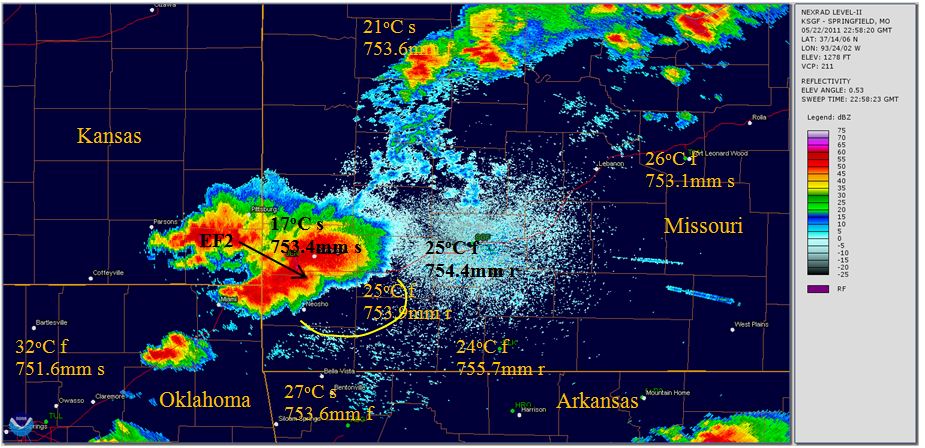
Fig. 13. 2258 UTC 22 May 2011, 18 minutes into Joplin event.
Figure 13 shows the tornado continuing to track east along the southern edge of Jasper County. The associated region of closure continues to shrink, although it remains well defined, and the tornado loses intensity. The eastern edge of the closure boundary is likely to be near Monett where the temperature begins to fall and pressure moves back up to 753.9mm Hg, then remains steady. The tornado turns southeast and crosses into Newton County at 2300 UTC with reduced EF2 intensity.
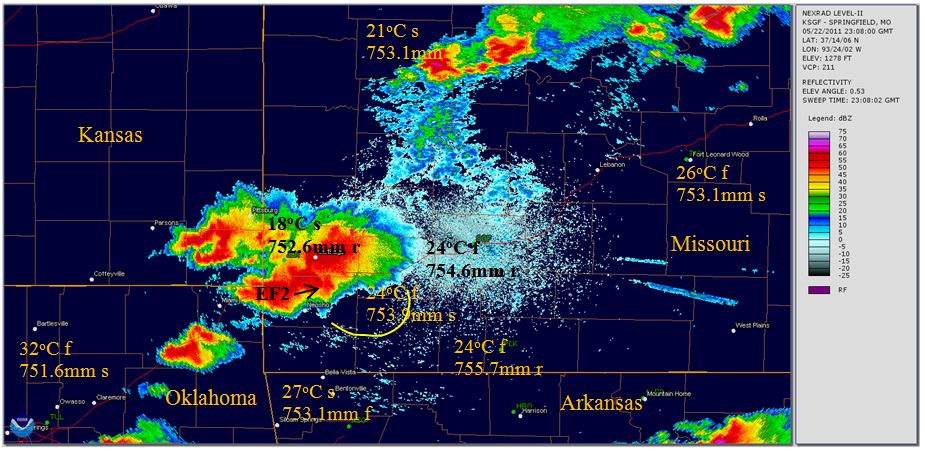
Fig. 14. 2308 UTC 22 May 2011, 28 minutes into Joplin event.
Figure 14 shows that, 12 minutes before the end of the event, the tornado signature has lost definition, consistent with reported weakening. The region of closure remains well defined and steadily shrinking. The barometric pressure in Monett remains steady at 753.9mm Hg, while the temperature continues to gradually fall as the closure boundary moves through. This provides an indication that the pressure within the closure region is equivalent to the pressure beyond the closure boundary, the equilibrium pressurization of the trapped air.
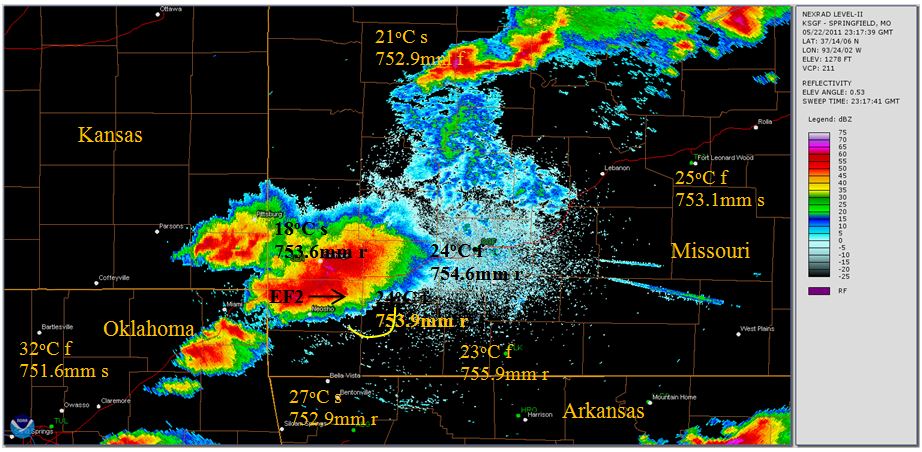
Fig. 15. 2317 UTC 22 May 2011, three minutes before the end of the Joplin event.
Figure 15 shows the conditions approaching the end of the event. The arrow indicates the approximate end coordinates of the event, with a vague associated hook echo. The closure region is nearly exhausted; however, remains adjoined to the tornado location. Establishing 2317 UTC as a reference point, the identified Joplin region of closure encompasses an area of approximately 196 km2. Conditions in Monett include falling temperature, barometric pressure steady at 753.9mm Hg, and corresponding relative humidity up to 89%. Then a gap occurs in the Monett records.
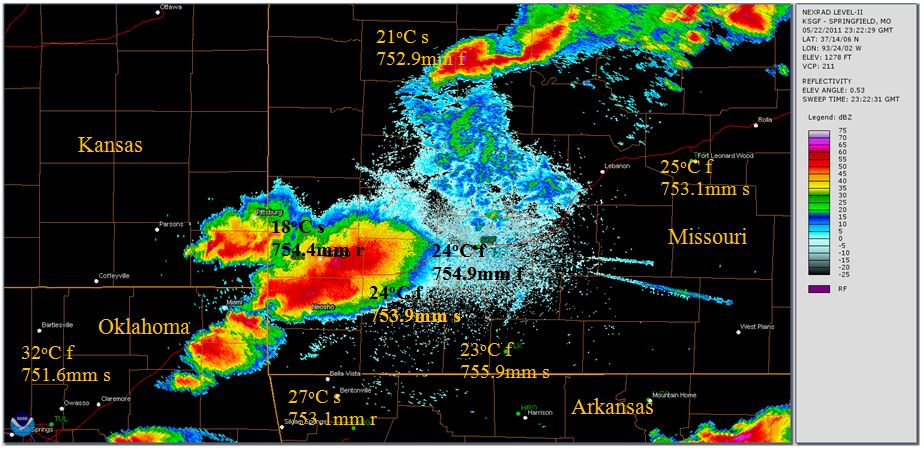
Fig. 16. 2322 UTC 22 May 2011, two minutes after the end of the Joplin event.
Figure 16, immediately following the recorded end of the Joplin event, shows no echo-free closure region and dissipation of the vortex echo, which has devolved back into a “horseshoe-shape.”
The Joplin event provides a relatively stable closure region over an extended period that lends itself to further analysis. Referencing back to the identified closure regions in Figures 10 and 15, the following provides an indication of the possible order of magnitude of air movement:
- At 2239 UTC the closure region covered an area of approximately 1,566 km2. At 2317 UTC the closure region was reduced to approximately 196 km2.
- Assume that the average ceiling altitude in the closure region was approximately 0.25 km at 2239 UTC and approximately 0.20 km at 2317 UTC.
- The elapsed time was (2317 – 2239 =) 38 minutes, or 0.63 hours.
- The maximum width of the tornado path was recorded as 1,600 yards in the NCDC Storm Events Database. Assume that the average diameter of the tornado vortex over the course of the event was half that, 800 yards = 0.73 km.
Given these assumptions; and the further simplifying assumptions of constant pressure, constant temperature, and laminar flow; the average velocity of air escaping vertically in the tornado vortex was likely on the order of:
[(1566 x 0.25 – 196 x 0.20) km3] / [3.14 x (0.73 km/2)2] / 0.63 hours = 1,336 kh-1
Additional research into the boundaries of closure regions, their ceiling altitudes, vortex diameters, and high velocity cyclonic air flow characteristics will be necessary to ultimately determine how reasonable this calculation is. However, given that the speed of sound is approximately 1,250 kh-1 at 26oC, it is very likely that the “freight train” sound that tornado survivors consistently describe is a continuous sonic shock wave as air accelerates beyond the speed of sound into the tornado vortex. The energy it takes to make the jump to supersonic velocity could be a significant transition factor in the equilibrium equation.
Back to Case Study Introduction
